
I'd like to see the 'X' factor changed from a straight 0.0 - 1.0 ranged value to a weighted value. With this idea, it would still vary from 0.0 to 1.0, but by utilizing a weighted value -- a mean value which would vary along that 0.0 to 1.0 range -- would bias the 'X' factor towards itself. This varied mean value could be calculated by utilizing some combination of the SBDE, the "us vs. them" ratio, and/or a secondary 'X' factor to fit into a calculation using the standard deviation formula.
From wikipedia, "In statistics, the standard deviation (SD) is a measure that is used to quantify the amount of variation or dispersion of a set of data values. A low standard deviation indicates that the data points tend to be close to the mean (also called the expected value) of the set, while a high standard deviation indicates that the data points are spread out over a wider range of values."
Refer to the standard deviation reference in Wikipedia for details on how to do this. I include two links at the bottom of this page that show how easy it is to do this. Depending on the various factors involved, one might have either a "normal distribution" or a weighted (skewed) distribution. I would like to see a skewed distribution based on the previously-mentioned combination of affecting values for the formulation of the standard deviation.
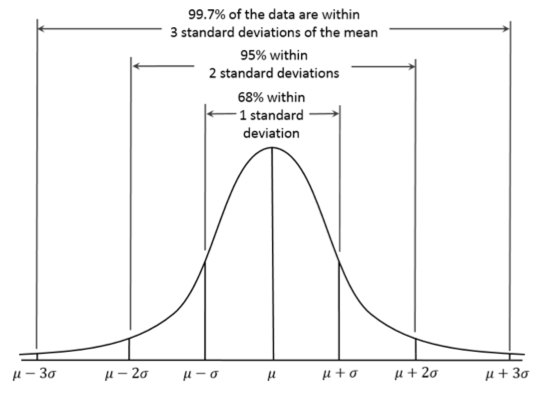
Example of a normal distribution of values determined by their standard deviation:

From Wikipedia, this is "a plot of normal distribution (or bell-shaped curve) where each band has a width of 1 standard deviation". Note that a standard deviation is denoted by the sigma Greek letter "σ". The deviation indicates the likelihood of a random value within a range is likely to occur. In the above normal distribution, the area under the curve represents the total likelihood of a random value (within a selected range of values) occurring within that band. Thus, a value of 0σ to -1σ is likely to occur about 34.1% of the time when a statistically random value is given (again, within that selected range of values).
This is another example of a normal distribution of a standard deviation.
In order to have the various factors (i.e., SBDE, the "us vs. them" ratio, a secondary 'X' factor, etc.) properly affect the mean of the standard deviation, you would need to skew the standard deviation to better-represent the true randomness of the 'X' factor value without removing the obvious benefits of having the standard deviation bias.
Example of a skewed standard deviation:
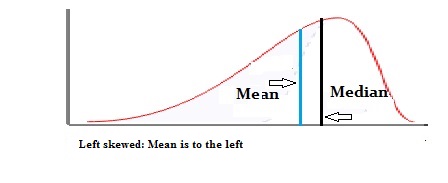
From Statistics How To, "Skewness is a measure of symmetry in a distribution. Actually, it’s more correct to describe it as a measure of lack of symmetry. A standard normal distribution is perfectly symmetrical and has zero skew."
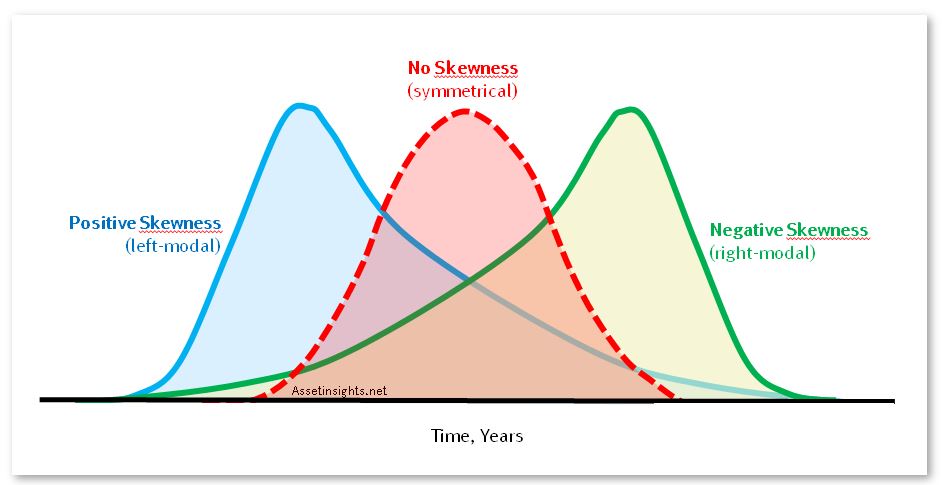
Example showing both left and right skewness of a standard deviation:
Example of the details of a probability distribution of a skewed standard deviation:
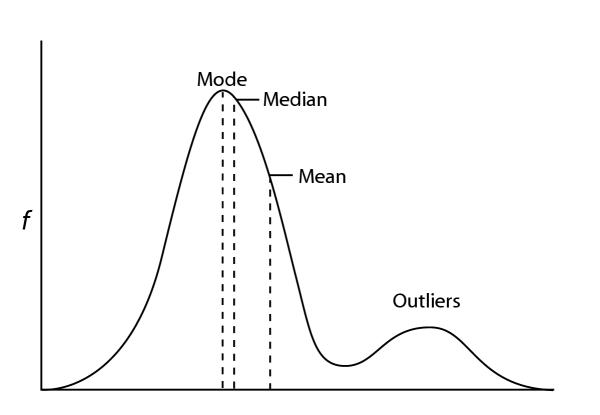
From Asset Insights:
This is the basic formula for determining the single standard deviation value (the sigma "σ" value). It looks complicated, but it's really not so bad. See below on how to easily come up with the various values to put into the formula...as well as how to modify the formula to fit one's needs.
Simply put, the standard deviation is the square root of a sample set of the variation of values within a range. This easy to follow Math is Fun web page shows how to determine and calculate the "variance" of the standard deviation. This other easy to follow Math is Fun web page better explains how to easily create and use the standard deviation formula, in general.
From wikipedia, "In statistics, the standard deviation (SD) is a measure that is used to quantify the amount of variation or dispersion of a set of data values. A low standard deviation indicates that the data points tend to be close to the mean (also called the expected value) of the set, while a high standard deviation indicates that the data points are spread out over a wider range of values."
Refer to the standard deviation reference in Wikipedia for details on how to do this. I include two links at the bottom of this page that show how easy it is to do this. Depending on the various factors involved, one might have either a "normal distribution" or a weighted (skewed) distribution. I would like to see a skewed distribution based on the previously-mentioned combination of affecting values for the formulation of the standard deviation.
Example of a normal distribution of values determined by their standard deviation:
From Wikipedia, this is "a plot of normal distribution (or bell-shaped curve) where each band has a width of 1 standard deviation". Note that a standard deviation is denoted by the sigma Greek letter "σ". The deviation indicates the likelihood of a random value within a range is likely to occur. In the above normal distribution, the area under the curve represents the total likelihood of a random value (within a selected range of values) occurring within that band. Thus, a value of 0σ to -1σ is likely to occur about 34.1% of the time when a statistically random value is given (again, within that selected range of values).
This is another example of a normal distribution of a standard deviation.
In order to have the various factors (i.e., SBDE, the "us vs. them" ratio, a secondary 'X' factor, etc.) properly affect the mean of the standard deviation, you would need to skew the standard deviation to better-represent the true randomness of the 'X' factor value without removing the obvious benefits of having the standard deviation bias.
Example of a skewed standard deviation:
From Statistics How To, "Skewness is a measure of symmetry in a distribution. Actually, it’s more correct to describe it as a measure of lack of symmetry. A standard normal distribution is perfectly symmetrical and has zero skew."
Example showing both left and right skewness of a standard deviation:
Example of the details of a probability distribution of a skewed standard deviation:
From Asset Insights:
- Mean: In statistics, the mean is the average of a data set on a probability distribution. The mean is derived by sum of the values divided by the number of values.
- Mode: In statistics, the the mode is the number that appears most frequently in a distribution of numbers.
- Median: In statistics, the median is the middle point between the higher half and lower half of a probability distribution.
This is the basic formula for determining the single standard deviation value (the sigma "σ" value). It looks complicated, but it's really not so bad. See below on how to easily come up with the various values to put into the formula...as well as how to modify the formula to fit one's needs.
Simply put, the standard deviation is the square root of a sample set of the variation of values within a range. This easy to follow Math is Fun web page shows how to determine and calculate the "variance" of the standard deviation. This other easy to follow Math is Fun web page better explains how to easily create and use the standard deviation formula, in general.

The saying, "beating them into submission until payday", is just golden...pun intended.
R.I.P. Snickers


 The overkill factor is indeed a defensive mechanism that lowers the incoming damage to an army or unit. To put it simply, units in the game try to survive as long as possible. The formula should resembles something like this: